Avichal Kulshrestha, Staff Technical Marketing Engineer, National Instruments
The most common RF measurement is RF power. Before performing any other tests, the engineer wants to know, “Is my DUT outputting power? Is it outputting power within specified parameters?” Testing RF power answers these questions and is the first indication of the system’s health.
RF power measurements take many forms, depending on the RF transmitter design and application. The RF output may be a simple continuous wave (CW) signal, a pulse, an analog modulated signal, or a complex digitally modulated transmission, such as an IQ or orthogonal frequency division multiplexing (OFDM) waveform. Among the types of RF power measurements, the steady state RF power of a CW tone is perhaps the simplest. Peak power, such as the overshoot of an RF pulse or IQ waveform, is the maximum value over some period. The power measurement can be averaged across a period, such as across a series of RF pulses, yielding the average power. RF power can be integrated over a frequency band, as is the case for many mobile communication signals. Digitally modulated signals tend to be noise-like in nature and often have specified average and peak power values.

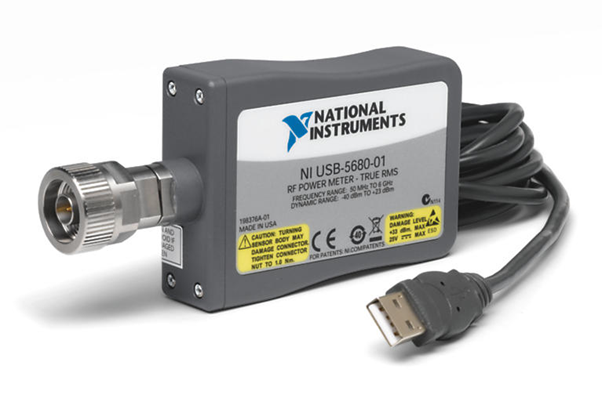
One accurate and cost-effective instrument for measuring RF power is the RF power meter. Because it’s a scalar instrument, incapable of measuring phase, care should be taken to minimize impedance mismatches whose reflections can add in and out of phase with the signal being measured, resulting in greater magnitude uncertainty. Power meters are broadband and not frequency selective, so any unwanted signals are averaged into the desired measurement. The dynamic range of most power meters is 50 to 70 dB. High-end power meters are capable of specialized measurements such as integrated power across a band and triggering for pulsed RF power. For these reasons, power meters are a good choice if the RF environment is well controlled.
Another instrument commonly used to measure RF power is a spectrum analyzer. With these more complex RF instruments, engineers can measure the individual spectral components across frequency. The absolute power measurement accuracy is not outstanding, typically + 0.5 to + 2.0 dB. However, the relative power accuracy (or amplitude linearity) is excellent. Therefore, calibrating at a given frequency with a known power level, from a signal generator, for example, results in corrected power measurements that are accurate across a dynamic range greater than 100 dB.
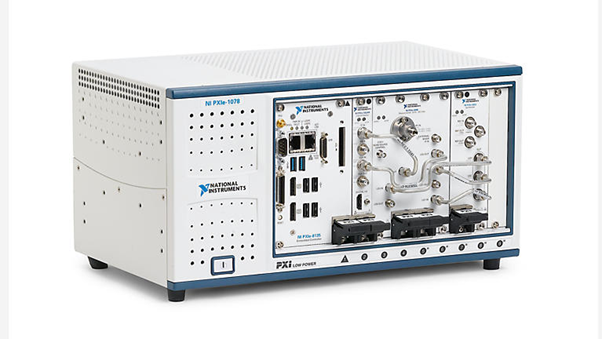
High-performance RF instruments, including vector signal analyzers and vector network analyzers, can measure magnitude and phase, offering the potential for greater error correction and measurement accuracy. In addition to the RF power measurements mentioned previously, specialty measurements can be made on pulsed and other complex RF waveforms. This includes pulse profiling, which measures the power across the envelope of an RF pulse, along with the average and peak power of the RF pulse. Complex IQ waveforms are measured in more of a noise-like fashion with measurements such as peak-to-average ratio, and complementary cumulative distribution function (CCDF).
Next let us investigate two key settings of RF analyzers: reference level and resolution bandwidth (RBW), and how they effect a power measurement.
Reference Level
The reference level setting tells the analyzer the expected RMS power of all signals entering the analyzer. This is an important measurement setting for a couple of reasons. First, it adjusts gain and attenuation stages in the signal path to reduce compression in the amplification stages and prevent damage to the device. Second, it attempts to optimize its gain and attenuation settings to minimize noise in the measurement. Hence, it’s important to understand the nature of the input signal and to choose an appropriate reference level for the instrument. Adjusting the reference level too high or too low can affect a power measurement. A higher value would result in the signal being attenuated even though it was not of very high power resulting in noise floor dominating the signal. Setting a lower value can be harmful in that lower value would not attenuate the signal as much as is needed to ensure safety on the receiver chain on the analyzer. Ideally reference level should be kept just above the maximum expected power at the input of the meter or analyser. Most analyzers from leaders such as NI do provide a protection circuit in case you set up the reference level too close to expected power and there was excess power applied unwillingly.
Resolution Bandwidth
It’s worth briefly discussing resolution bandwidth as it relates to traditional swept-tuned spectrum analyzers. In swept-tuned analyzers, the RBW filter is implemented in hardware with a power sensor directly following it. Depending on the RBW and span that is configured, the signal is stepped through the filter in frequency to capture the average power in the frequency window. The average power in each step is then plotted on the spectrum. For this reason, a smaller RBW causes the measurement to take longer since the signal must be moved multiple times to cover the entire configured measurement span. In addition, the signal must wait in each step long enough to overcome the delay inherent in the filter, which also adds time to the measurement.
NI Vector Signal Analyzers are FFT-based as opposed to the swept-tuned analyzers discussed above. The main difference is that instead of relying on hardware to move a signal through a bandpass RBW filter for frequency selective power analysis, the RBW filter is implemented in software through the Fast Fourier Transform. One key benefit to this is that analyzing small frequency spans is faster. In addition, FFT-based analyzers also can measure phase, which enables them to perform demodulation.

A higher RBW implies an acquisition with a larger number of points. For this reason, a RBW too large can cause system acquisition memory errors. As well, the power of the noise floor increases since the filter is wider and letting more noise through. A lower RBW implies a longer acquisition time with fewer points per step. As such, a RBW too small may not allow key signal characteristics to pass through, causing them to be missed. This is especially true for burst signals that are only active for a short amount of time wherein the frequency content of interest is located. When it comes to choosing the right RBW, it depends on the measurement and the type of signal that is being measured. For bursted signals, the RBW must be high enough to capture the entire signal’s bandwidth, but not so high that the noise floor becomes too large.
Conclusion
Measuring the power of an RF signal is key to characterizing and testing RF components and devices. Note that there are many different methods and types of equipment that can be used to measure power. This document provided an introduction into how to choose an appropriate reference level and RBW and the consequences of choosing a value too high or too low for the measurement. Reference level and RBW are basic settings that can have a noticeable impact on a power measurement, and it’s important to be able to apply some intuition when configuring and analyzing RF power measurements.


