As any builder, handyman, or software developer knows, the right tools make all the difference in meeting deadlines, working efficiently and delivering a quality product. In embedded development the quality of your tools often determines the length and difficulty of the project schedule, particularly when it comes to debugging, test, and software optimization.
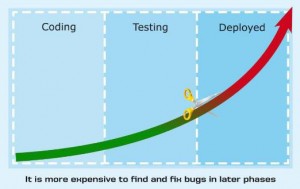
 Most developers will acknowledge that writing code is the easy part. But a nasty bug—whether it is a race condition, a seemingly random artifact or an unpredictable crash condition can leave a developer ready to tear his hair out. This is due in large part to ever-increasing system complexity as competitive pressure and market opportunity introduces new features within already tight delivery schedules.
Your challenge as the developer is to find development tools you can trust: tools that are easy and intuitive to use with powerful features that can assist you in writing better code and in resolving difficult problems or isolating hard-to-find bugs; and a knowledgeable and responsive tech support team to assist when you can’t figure out how to use the tool in your situation.
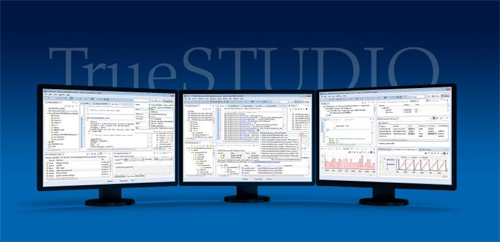
In this paper we will show you how the right tools can help you efficiently develop high quality software on ARM-based microcontrollers using the Atollic TrueSTUDIO C/C++ IDE. Since most development tools give you an editor, compiler, linker and debugger, we are going to spend time in this article on some of the advanced features that are not usually available in embedded tool chains.
We will touch on tools to help you improve the quality of your code and look at advanced debugging capabilities using powerful software visualization and analysis.
Overview
Atollic® TrueSTUDIO® development tools for ARM® devices are a step above other IDEs with an unmatched feature set for professional software development. These are the kind of tools you want on your desktop if you are serious about your code and about keeping your project on track.
Some of these powerful features include project wizards, parallel compilation, MISRA-C checking, code complexity analysis, and source code review features plus RTOS-aware debugging with a built-in crash analyzer, support for multicore and multi-processor debug, event-, data- and instruction tracing, peripheral register viewers, and real-time variable watch.
 High quality code starts at the beginning
One way to reduce the number of bugs you need to track down is to improve the quality of the code you write in the first place. Since there are numerous books and articles on the topic of writing quality code we will not go into great detail on this topic. What we will say is that the right tools and development process can assist you in avoiding problematic code.
Integrated Code Analysis Tools
One way to assist you in improving code quality is to use static source code analysis tools. Such tools can examine the code you have written and give you a report back to help you make improvements. If such tools are integrated into the IDE it is even easier to apply these benefits rather than jumping in an out of your development environment.
Checking your code against a best-practice coding standard such as MISRA®-C can help you ensure that you are not using unsafe, unreliable or non-portable constructs in your software.
Even if you are well trained in the MISRA standard it is impossible to ensure coding standards compliance without support from a tool. TrueSTUDIO comes with a highly standards-compliant integrated MISRA-C code checker. When enabled, TrueSTUDIO automatically checks your code for compliance and identifies any code lines that break MISRA-C rules. It is the only embedded IDE that explains the MISRA rule for offending lines, and gives examples of good and bad code for each rule. Many developers use it as a teaching-aid because it highlights what code construct triggered the MISRA violation and shows you how to rewrite the code to remove the violation. Our MISRA checker additionally provides compliance statistics in textual and graphical format, for a quick at-a-glance overview of the current state.
Code Complexity Analysis and Code Metrics
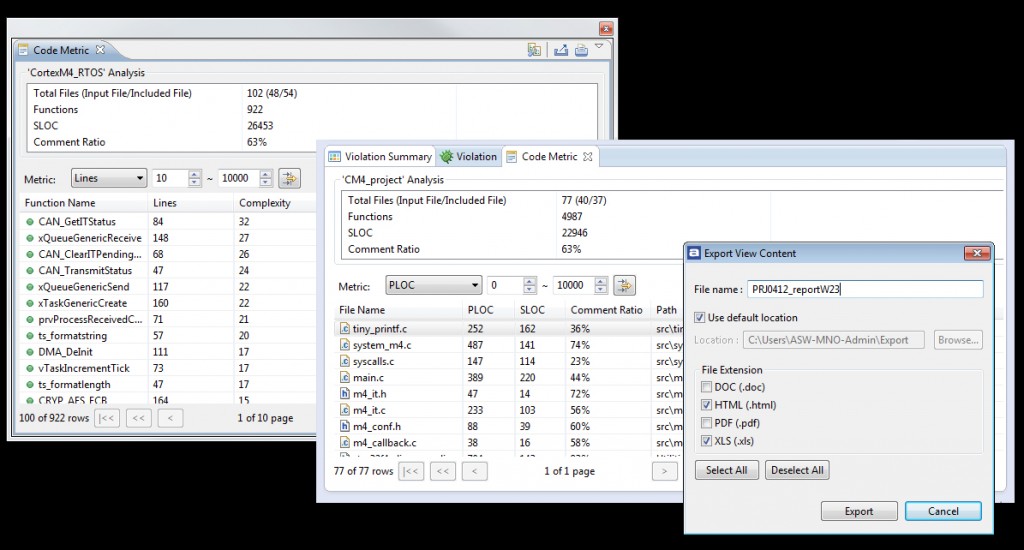
The complexity of your code is often an indicator of future problems because code that is too complex can be difficult to understand, test and maintain. The more iterations and conditional code a function has, the higher its complexity level and the more likely it is to include more errors. Fortunately, TrueSTUDIO includes a helpful tool that uses an industry-standard algorithm to measure the complexity of your code. Code complexity can easily be viewed for each C function in the project, along with information on the amount of code lines used to implement every function. Not only that, but TrueSTUDIO can provide other types of code metrics and even measure the number of lines in files and functions as well as the commenting level in the complete project or specific files. You can easily use this as part of your daily workflow, checking your code at defined intervals to measure the quality of your source code. Measuring and managing the code complexity of the C functions in your project is one of the cheapest and best ways of reducing the number of bugs and maintenance cost in your project.
Source Code Reviews
Similar to other code checking methodologies, peer review can also help you reduce bugs and defects early in the development. The principle is to have a formal process where other developers study the code and you study theirs at various times during development, such as before an alpha or beta release, or after implementing or rewriting a key feature of your software.
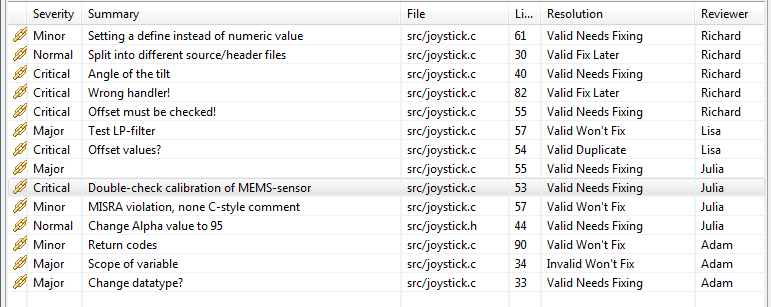
Atollic TrueSTUDIO® is the first embedded systems IDE to integrate features for source code reviews and to run code review meetings as a standard feature. The tool allows you to select the code for review and then gives each reviewer tools to comment on the code, indicating the type of problem and the severity. TrueSTUDIO then supports review meeting activities and tracks the resolution of each comment.
Many different categories of problems can be detected including, logic errors, portability problems, coding standard violations, optimization problems, etc. Each identified problem can then be assigned a proposed level of severity.
A source code review is typically performed in three stages:
- The individual review phase where the reviewers study the source code written by colleagues and make comments. Potential problems detected can for example be logic errors, portability problems, coding standard violations, optimization problems, etc. Each identified problem can then be assigned a proposed level of severity.
- The team review phase where reviewers discuss what to do with each identified problem area in a code review meeting, and possibly assign specific team members to rework the code. The code review meeting may, for example, decide a particular review comment is invalid, is valid but shall not be fixed, or is valid and must be corrected.
- The rework/problem fixing phase where select team members resolve the problems that have been assigned to them. As each item is corrected and ticked off, the project manager and other team members can monitor which items have been corrected and which still need attention.
Integrated Version Control System client
As complexity and code size grow for each year, so does the problem of managing software and development efforts. As the development progresses over time, it is typical for thousands of code changes to be made. If version control methodology is not used, it very quickly becomes unclear who made what changes, when and why. As time goes on valuable information about what the original code base looked like can be lost forever, making it impossible to revert to a previous code state of known working code. Whether you are a single developer or you have a large, geographically dispersed team, version control offers significant benefits.
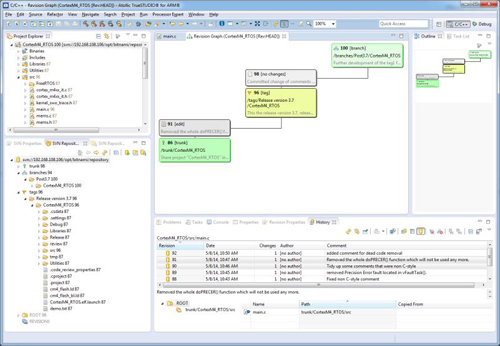
Atollic TrueSTUDIO integrates code management features right into the C/C++ development environment and provides a deeply integrated GUI client for version control tools like Subversion and GIT. Because you never have to leave the IDE you can benefit from substantial productivity increases over a separate, external version control system client. You can easily track changes over time, revert back to older code implementations, compare different versions or branch- and merge code bases developed in parallel.
Integrated Bug Tracking and Issue Management client
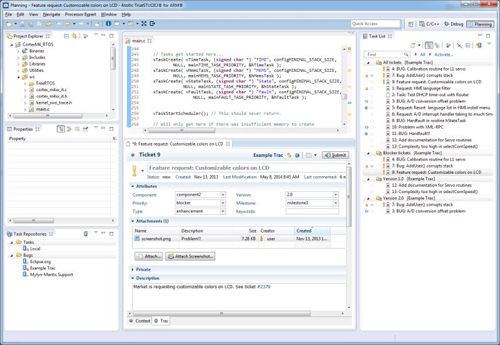
Atollic TrueSTUDIO is the first embedded IDE to integrate GUI clients that connect to popular bug database-, feature request- and issue management systems like Trac, Bugzilla or Mantis.
Using one of the integrated issue database clients, you can easily add new bug reports or feature requests, change status of them or query the database for issues or feature requests with various filters, such as all resolved bugs in a specific software release, all work tasks planned for an upcoming release or all feature requests assigned to myself for implementation. It is even possible to add screenshots (that can be cropped and annotated with arrows and text) as a file attachment filed with bug reports.
A colleague can then for example see what your debugger state looked like when you found the bug. Atollic TrueSTUDIO also brings context awareness to the bug report or feature request. If you work on say 3 files when solving a bug, those 3 files will be automatically opened and the cursor placed on the same places like last time, if the same bug report is opened weeks or months later.
The issue management tracking system is a perfect vehicle for planning and organizing the work in software development teams, and many development teams browse the issue management system in their weekly team meetings to discuss new bug reports, and prioritize to-do items like bug reports or feature requests in their weekly work planning.
Advanced Debugging Tools
Any developer with sufficient experience knows that some bugs can be incredibly difficult to find. This can cripple a project release schedule or add costly field upgrades. A modern debugger needs to include sophisticated capabilities for powerful system analysis and advanced debugging to help you avoid these scenarios.
Gone are the days when simple single-step/run-to-breakpoint/printf-style debugging was sufficient for reasonably sized projects. Today’s debugger needs to include features for event-, data- and instruction tracing to capture execution history for later analysis, crash analyzers to help you work out why your software brought the CPU into a fault state, RTOS-specific kernel aware debugger features, etc. Multiple processors or multiple cores adds even more to the list of debugger capabilities.
Crash Analyzer for Cortex-M cores
What do you do after a system crash? Diagnosing the reasons behind a system crash without good tool support can be a time-intensive and an incredibly frustrating effort. The system may occasionally crash for no apparent reason, often very rarely and perhaps only after hours of execution, for example due to a sensor sometimes sending out-of-range data. These types of problems are very difficult to find. CPU faults occur due to the software bringing the CPU into an invalid state, for example due to memory management problems, executing illegal instructions or program errors like division by zero or pointer errors, or various types of bus faults such as accessing a word on an unaligned address.
TrueSTUDIO is the first embedded IDE to include a crash analyzer, automatically what brought the system into a fault state. In addition to visualizing where the system crashed, the TrueSTUDIO crash analyzer also tells you why it happened and under what circumstances it crashed.
Advanced System Analysis
It is now possible to have greater visibility into the dynamics of complex real-time embedded applications than ever before. This visibility is extremely useful not only in the increasingly complex applications typically found in today’s products, but in applications that cannot be halted for the debugging process.
Atollic TrueSTUDIO provides advanced features for powerful debugging using event/data/software-tracing with the Serial Wire Viewer (SWV), Serial Wire Output (SWO) and Instrumentation Trace Macrocell (ITM) technologies. These technologies combined allow various types of data from the running system to be output in real-time during full execution speed, through the JTAG cable.
Being able to visualize the time evolution of specific variables and other events as the application executes can give you valuable insights into:
- Whether or not control algorithms are functioning properly
- Whether or not memory locations are being corrupted inadvertently
- Whether or not pointers are behaving as expected
- Locating sections of code that require optimization
- Locating specific lines of code that are causing memory corruption
- Determining whether or not interrupts are firing as expected
- The internal behavior of real-time operating systems and other middleware
Atollic TrueSTUDIO includes a state-of-the-art implementation of SWV real-time tracing with powerful features for advanced system analysis, including real-time graphical charts.
- Real-time display of variable values or memory address value
- History log with all reads or writes to a location, and what code line made them
- Interrupt and exception tracing with execution time statistics
- Measuring execution time between two independent locations in the code
- Graphical real-time charts
- printf() redirection to 32 parallel and independent ITM ports
- Software tracing using ITM instrumentation
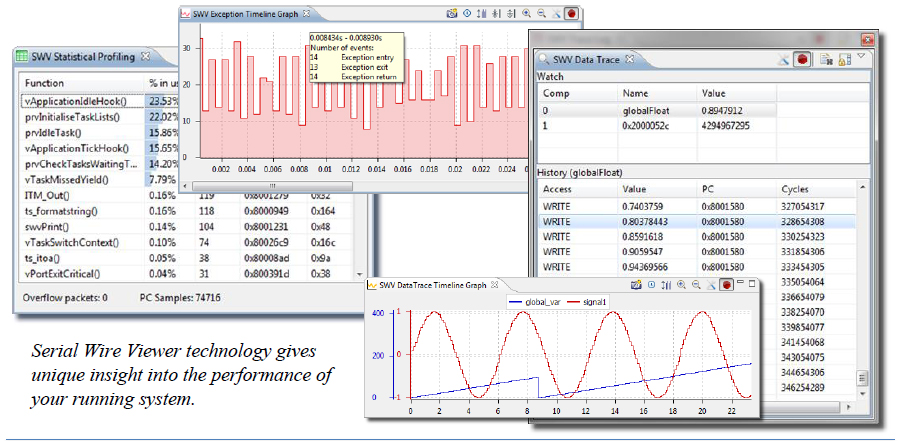
For example, the data trace view visualize variable- or memory-values in real-time during full execution speed non-intrusively, and it provides an accurate history log of all reads- and writes- to a particular location. A double-click on a particular read or write in the memory access history log brings you to the code line who made the read or write to that variable or memory location. It is thus incredibly easy to find out what code line inadvertently overwrites a variable value occasionally, for example.
The real-time event logs can be used to study how interrupts fire, or their nesting. For execution time measurement and optimization, statistical profiling and execution time measurement capabilities are included; for example by providing bar charts of the execution time of various C functions, measuring the execution time between two independent parts of the software, or to study interrupt handler min/max/average execution times, etc. TrueSTUDIO also includes support for software tracing using the ITM interface that is part of SWV, enabling redirection of printf() output to a debugger console over the JTAG cable, for example.
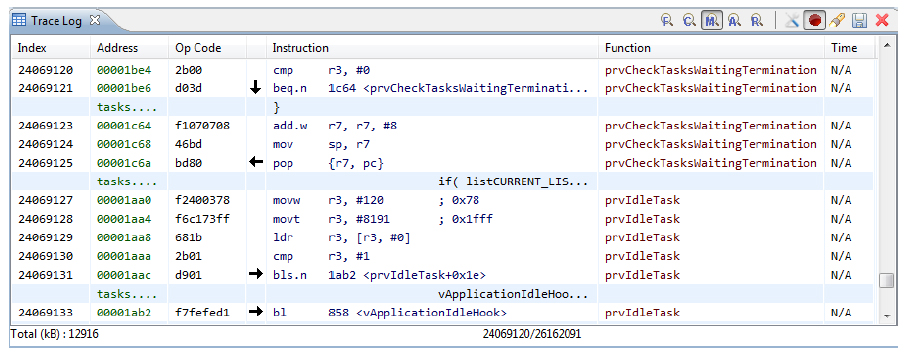
In addition to the SWV event- and data- tracing, a modern debugger of today needs to support ETM/ETB instruction tracing too, thus recording the history of the execution flow for offline analysis.
The instruction trace is particularly valuable in systems where execution cannot be allowed to stop on a breakpoint, for example motor control applications. Using the instruction trace, developers can anyhow understand the execution flow when debugging the application. Due to the huge amount of data recorded (100MB binary packed or 5-10GB for human readable format, for each second of execution time on a Cortex-M4) advanced start/stop triggers or trace breakpoint triggers typically control when trace recording should be started and stopped, to reduce the massive amount of data that is collected.
Developers can additionally “zoom” in- and out- to get various levels of details, such as function trace, C trace, Mixed mode trace or Assembly only trace.
RTOS-Aware Debugging
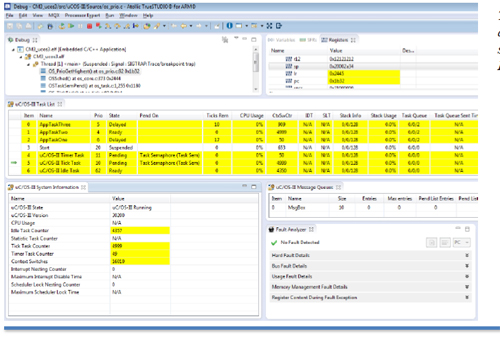
Because commercial development tools are not usually developed for use with a specific RTOS, the debugger views are generic and are unable to display kernel-specific data structures in any meaningful way. With kernel-aware debugging capability when the debugger hits a breakpoint you can view the state of RTOS objects such as tasks, semaphores, mutexes and timers in much greater detail. When you combine Kernel-aware debugging and Serial Wire Viewer event- and data- tracing, you can get even more insights because you do not have to stop the system to gather meaningful data. TrueSTUDIO offers RTOS kernel aware debugging for many popular real-time operating systems including embOS, ThreadX, μC/OS, FreeRTOS and RTXC.
Summary
Many factors conspire together to make embedded development challenging. More complex application demands, more peripherals, geographically dispersed teams or reduced team size, shorter development schedules, and demanding bosses are just some of the variables that can add to the stress of your job and jeopardized the success of your project.
We all know that good tools can make a dramatic difference in developing code, especially in debug and test. Affordable professional tools such as Atollic TrueSTUDIO can help you write and maintain higher quality code and dramatically reduce the time and frustration of debugging.


