Wei Gu, Analog Devices
When a power supply designer wants to gain a general understanding of a power supply’s feedback loop, they turn to Bode plots of loop gain and phase. Knowing the loop response can be predictive, helping to narrow the field of feedback loop compensation components. The most accurate way to produce the gain and phase plots is to put the supply on the bench and use a network analyzer, but in the early stages of design, most designers prefer turning to a computer simulation, which can help them quickly settle on a rough range of components—and help build an intuitive understanding of the loop response to parametric changes.
This article focuses on a feedback control model for current-mode control power supplies. Current-mode control is popular in switch-mode DC-to-DC converters and regulators because it has a number of advantages over voltage-mode control: better line noise rejection, automatic overcurrent protection, easy parallel operation, and improved dynamic response.
Designers already have access to a significant number of current-mode power supply average models. Some are accurate to half the switching frequency—matching the increasing bandwidth of converters—but only for limited topologies, such as buck, boost, and buck-boost (not 4-switch buck-boost). Unfortunately, 3-terminal or 4-terminal average models for use with topologies such as SEPIC and Ćuk are not accurate up to half the switching frequency.
In this article, we present an LTspice® simulation model that is accurate up to half the frequency (even relatively high frequency), for a wide range of topologies, including:
- Buck
- Boost
- Buck-boost
- SEPIC
- Ćuk
- Forward
- Flyback
Simulation for piecewise linear system (SIMPLIS) results are presented to confirm the validity of the new model, and specific applications of the model are shown in examples. For some examples, bench results are used to validate the model.
Current-Mode Control Modeling: A Very Brief Overview
Here, we’ll revisit some of the highlights of current-mode control modeling. For a more complete understanding of current-mode modeling, turn to the publications noted in the References section at the end of this article.
The purpose of the current loop is to make the inductor current follow the control signal. In the current loop, averaged inductor-current information is fed back to a modulator with sensing gain. Modulator gain Fm is derived by geometrical calculations, assuming a constant inductor current ramp and an external ramp. To model the effect of the variation of the inductor current ramp, two additional gains are added to the model: feed forward gain (kf) and feedback gain (kr), as shown in Figure 1.

Figure 1. Average model for current-mode control by R. D. Middlebrook.
In order to extend the validity of the average model as shown in Figure 1 into the high frequency range, several modified average models are proposed based on the results of discrete-time analysis and sample-data analysis. In R. B. Ridley’s model (see Figure 2), sample-and-hold effects are equivalently represented by the He(s) function, which is inserted into the feedback path of the inductor current in the continuous average model. Due to its origination from the discrete-time model, this model can accurately predict subharmonic oscillations.

Figure 2. Modified average model for current-mode control by R. B. Ridley.
Another modified average model is proposed by F. D. Tan and R. D. Middlebrook. In order to consider the sampling effects in the current loop, one additional pole must be added to a current-loop gain derived from the low frequency model, as shown in Figure 3.

Figure 3. Modified average model for current-mode control by F. D. Tan.
In addition to R. B. Ridley’s model, the current programmed controller model introduced by R. W. Erickson is also very popular. The inductor current waveform is illustrated in Figure 4.

Figure 4. Steady-state inductor current waveform with an external ramp.
The average inductor current is expressed as:

where iL is the sensed current, ic is the current command from the error amplifier, Ma is the artificial ramp slope, and m1 and m2 are the upward and downward slopes of output inductor current. Perturbation and linearization results in:

Based on this equation and the canonical switch model, current-mode converter models can be obtained.
A New Modified Average Model
R. W. Erickson’s model gives power supply designers excellent physical insight, but it is not accurate up to half the switching frequency. In order to extend the validation of the model to the high frequency range, a modified average model (see Figure 5) is proposed based on the results of discrete-time analysis and sample-data analysis.

Figure 5. Proposed modified average model for current-mode control.
Sampled-data modeling of inductor dynamics establishes:

where T is the switch period and

Gic(s) of the model shown in Figure 5 can be derived:

where ωc is the crossover frequency of the inner current loop Ti as shown in Figure 5, with the values ωc of various topologies derived and shown in Table 1.

A Buck Converter Example
In Figure 5, we treat the Fv feedback loop and iL feedback loops in parallel. We could also draw the Fv feedback loop as internal to the iL feedback loop. A complete buck converter model with the added Gic(s) stage is shown in Figure 6.

Figure 6. Block diagram of the modified average model for a buck converter.
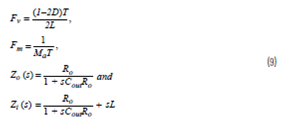
The control-to-output transfer function Gvc (s) is

The current loop gain Ti (s) and voltage loop gain Tv (s) are calculated by:

And

where,

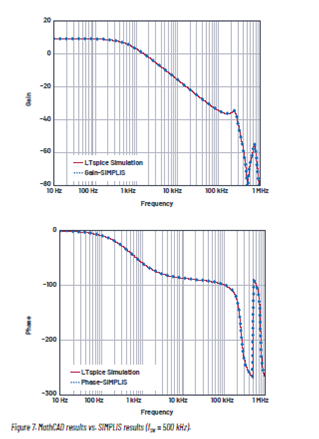
In Figure 7, calculated loop gain based on the new current-mode model agrees well with SIMPLIS results. In this example, VIN = 12 V, VOUT = 6 V, IOUT = 3 A, L = 10 μH, COUT = 100 μF, and fSW = 500 kHz.

Figure 7. MathCAD results vs. SIMPLIS results (fSW = 500 kHz).
A 4-Terminal Model with LTspice
A 4-terminal model is built based on the modified average model shown in Figure 5. This 4-terminal model can be used to analyze any PWM topology for DC and small-signal characteristics using a standard electronic circuit analysis program, such as the free LTspice, in closed-loop operation.
Figure 8 shows LTspice simulation schematics for various topologies using the same model for each. The feedback resistor divider, error amplifier, and compensation components are not drawn here. To use the model with a real DC-to-DC converter model, the output of the error amplifier should be connected to the VC pin.

Figure 8. Using the LTspice model for various topologies: (a) buck, (b) boost, (c) SEPIC, (d) Ćuk, and (e) flyback.
The various LTspice behavioral voltage source directives in Figure 8 are shown in Table 2. E1 is the voltage across the inductor when the switch is on, E2 is the voltage when the switch is off, V3 is the slope compensation amplitude, and Ei is the inductor current.

The simulation results for a SEPIC converter with two separated inductors are shown in Figure 9, which match the SIMPLIS results up to half the switching frequency. In this example: VIN = 20 V, VOUT = 12 V, IOUT = 3 A, L = 4.7 μH, COUT = 120 μF, C1 = 10 μF, and fSW = 300 kHz.

Figure 9. LTspice results vs. SIMPLIS results for a SEPIC converter (fSW = 300 kHz).

Figure 10. LT3580 LTspice model.
Bench Verification of the New Models
The new LTspice models in Figure 11 were bench verified for topologies previously unsupported by traditional models, including Ćuk, and 4-quadrant and 4-switch buck-boost.

Figure 11. Bode plot (fSW = 2 MHz).
Verifying the Ćuk Regulator Model on the Bench
The LT3580 is a PWM DC-to-DC converter containing an internal 2 A, 42 V switch. The LT3580 can be configured as either a boost, SEPIC, or Ćuk converter, and its AC model can be used for all of these topologies. Figure 10 shows a Ćuk converter with fSW = 2 MHz and VOUT = –5 V. Figure 11 compares the LTspice simulation Bode plots with bench results—they match well up to half the switching frequency.
Verifying a 4-Quadrant Regulator Model on the Bench
The LT8714 is a synchronous PWM DC-to-DC controller designed for a 4-quadrant output converter. The output voltage cleanly transitions through zero volts with sourcing and sinking output current capability. The LT8714 is ideal for regulating to positive, negative, or zero-volt outputs when configured for the novel 4-quadrant topology. Applications include 4-quadrant power supplies, high power bidirectional current sources, active loads, and high power, low frequency signal amplification.
Based on the CONTROL pin voltage, the output can be positive or negative. In the example shown in Figure 12, when the pin voltage is 0.1 V, the output is –5 V, and when the pin voltage is 1 V, the output is 5 V, VIN is 12 V, and the switching frequency is 200 kHz.

Figure 12. A 4-quadrant regulator LTspice model using the LT8714.
Figure 13 compares the LTspice simulation Bode plots with those produced on the benchtop—they match well up to half the switching frequency. The control voltage (CONTROL) is 1 V, which sets VOUT (OUT) to 5 V.

Figure 13. Bode plot (fSW = 200 kHz).
Figure 14 compares the LTspice simulation Bode plots with bench results—matching well up to half the switching frequency. The control voltage (CONTROL) is 0.1 V, which sets VOUT (OUT) to –5 V.

Figure 14. Bode plot (fSW = 200 kHz).
Verifying a 4-Switch Buck-Boost Model on the Bench
The LT8390 is a synchronous 4-switch buck-boost DC-to-DC controller that can regulate the output voltage (and input or output current) from an input voltage above, below, or equal to the output voltage. The proprietary peak-buck/peak-boost current-mode control scheme allows adjustable fixed frequency operation.
The LT8390 LTspice AC model monitors the input and output voltages and automatically picks one of the four operation modes: buck, peak-buck, peak-boost, and boost. An LT8390 example circuit is shown in Figure 15. The LTspice simulation and bench results are shown in Figure 16 and Figure 17 for buck and boost mode, respectively. The curves match well up to half the switching frequency.

Figure 15. LT8390 LTspice model.

Figure 16. Bode plot (fSW = 150 kHz). VIN = 20 V, VOUT = 12 V, and IOUT = 5 A.

Figure 17. Bode plot (fSW = 150 kHz). VIN = 8 V, VOUT = 12 V, and IOUT = 5 A.
Summary
A current-mode control model is established to provide both the accuracy of the sample-data model and the simplicity and versatility of a 4-terminal switch model. A unified LTspice model—accurate up to half the switching frequency—for buck, boost, buck-boost, SEPIC, Ćuk, flyback, and forward topologies is presented. The LTspice results are validated by bench data. The model is intended for loop analysis in design of current-mode converters in continuous conduction mode.
References
Basso, Christophe P. Switch-Mode Power Supply SPICE Cookbook, 1st edition, McGraw-Hill, 2001.
Erickson, Robert W., and Maksimovic, Dragan. Fundamentals of Power Electronics, 2nd edition, Chapter 11, Kluwer (Springer), 2001.
Li, Jian, and Lee, Fred C. “New Modeling Approach and Equivalent Circuit Representation for Current-Mode Control,” IEEE Transactions on Power Electronics, Vol. 25, No. 5, May 2010.
Maksimović, Dragan. “Current Programmed Control,” ECEN 5807, University of Colorado, 2009.
Middlebrook, R. D. “Modeling Current-Programmed Buck and Boost Regulators,” IEEE Transactions on Power Electronics, Vol. 4, No. 1, January 1989.
Ridley, R. B. “A New, Continuous-Time Model for Current-Mode Control (Power Converters),” IEEE Transactions on Power Electronics, Vol. 6, No. 2, April 1991.
Tan, F. D., and Middlebrook, R. D. “A Unified Model for Current-Programmed Converters,” IEEE Transactions on Power Electronics, Vol. 10, No. 4, July 1995.
Author
Wei Gu is an applications director for power products. He joined Linear Technology (now part of Analog Devices) in 2006. He received a B.S. in electrical engineering from Zhejiang University and a Ph.D. in electrical engineering from the University of Central Florida.


