
This article describes the benefits of using IAR Embedded Workbench® and Micriµm’s µC/Probe to test and validate an embedded design. It explains why embedded software developers interested in predicting with confidence that their embedded designs will work as expected when deployed, should keep µC/Probe in their toolbox.
Unlike software application development for Microsoft Windows, where a single integrated development environment (IDE) allows you not only to write and compile your code, but also debug it in your own PC with the highest level of fidelity, software development in embedded systems requires a lot more tools, and in the end, the only real test is in the field where any mistakes are likely to be costly.
If you are reading this, it means you are already familiar with the benefits of using IAR Systems software for programming embedded systems. Unlike other tools, IAR Embedded Workbench incorporates a compiler, an assembler, a linker and a debugger into one single integrated development environment (IDE). Their high-level-language debugger is called CSPY® and it is completely pre-integrated in the IDE, providing development and debugging within the same application.
IAR Systems’ C-SPY Debugger is a great tool to evaluate the embedded system’s details at the C implementation level. It offers multiple tools for looking at variables and their values such as the Live Watch Window shown in the figure below:
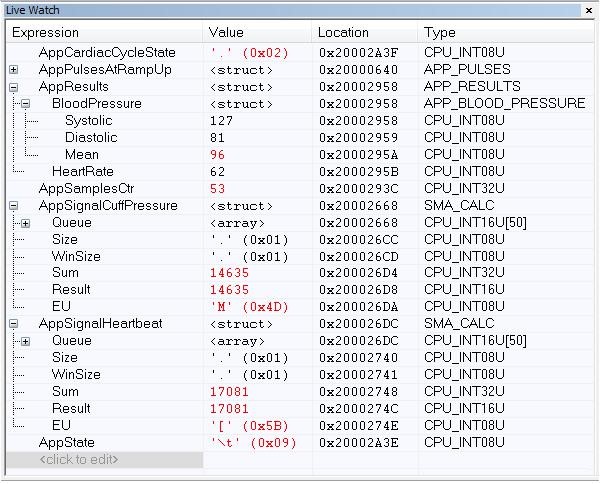
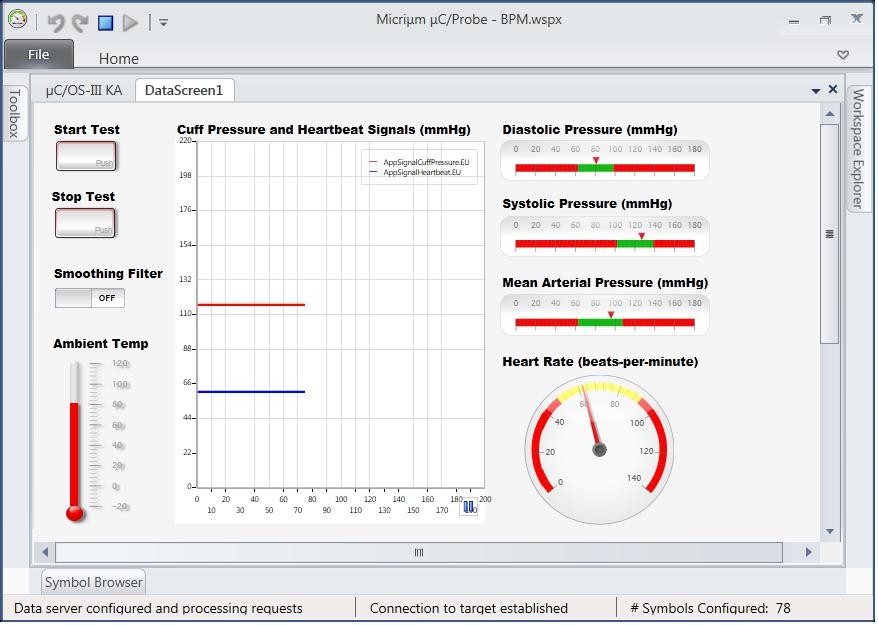
This Live Watch Window periodically samples and displays the value of expressions while your application is executing. Variables in the expressions must be declared as global variables, and you can add, modify, and remove expressions, and change the display format. Similar to C-SPY Live Watch Window, µC/Probe is a Windows application designed by Micriµm to read and write memory of any embedded target processor during run-time. The key difference is that memory locations are mapped to a set of virtual controls and indicators placed on a dashboard:
By having a dashboard for your C code, you are able to extend your debugging scope to a higher level where you can model the system and operate the model using virtual controls to simulate stimulus and virtual indicators to simulate response. This gives you a firm understanding of what the embedded system is doing at any given time in a non-intrusive way.
For instance, Figure 2 shows the augmented view of a Blood Pressure Monitor’s user interface, which includes extra indicators such as the graph, the temperature and filter button that even though they are not typically included in the finished product, they have the potential to help you identify issues or techniques to optimize your design at the early stage of development. For example, by testing your embedded design with this dashboard, you could notice that changes in ambient temperature are affecting the results and decide that you need to make the pressure sensor’s transfer function dependent on the ambient temperature. At the same time, you can try different types of filters at the signal conditioning stage and see the results in real-time. As you can imagine, the possibilities are endless.
Communication Interfaces
µC/Probe is tightly integrated with IAR Embedded Workbench thanks to a TCP/IP bridge between C-SPY and µC/Probe. This bridge gives µC/Probe access to not only its native supported platforms but also all the devices and processor architectures supported by IAR Systems without the need to write any target resident code in the form of communication routines, because C-SPY handles all communication needed as illustrated in the following figure:
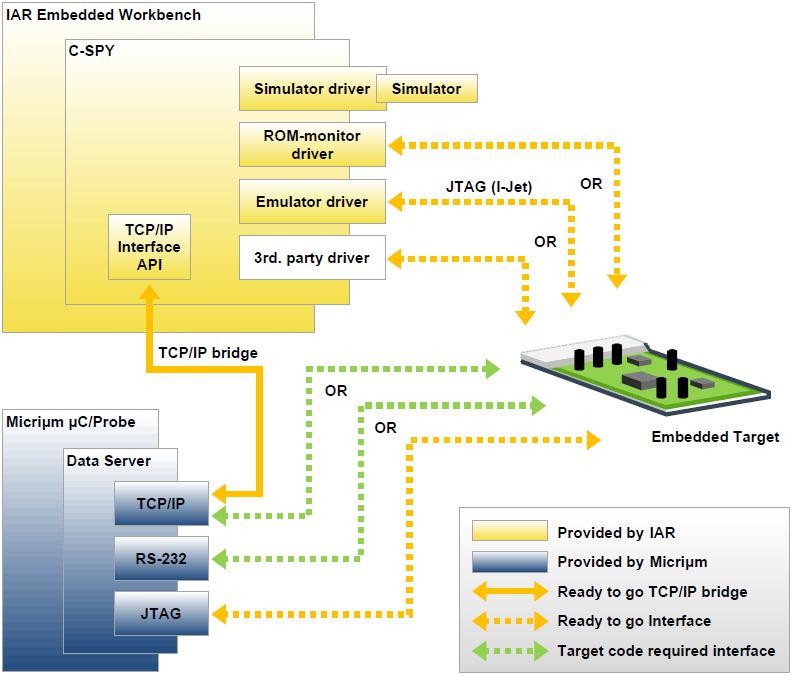
In regards to the communication interface options illustrated in Figure 3, some of them, such as the ones based on JTAG are ready-to-go assuming your embedded target has either an in-circuit debugger or an external JTAG probe (i.e. IAR Systems’ I-jet). Other communication interfaces require some resident code running in the embedded target, which is available by Micriµm for most platforms.
Design-Time
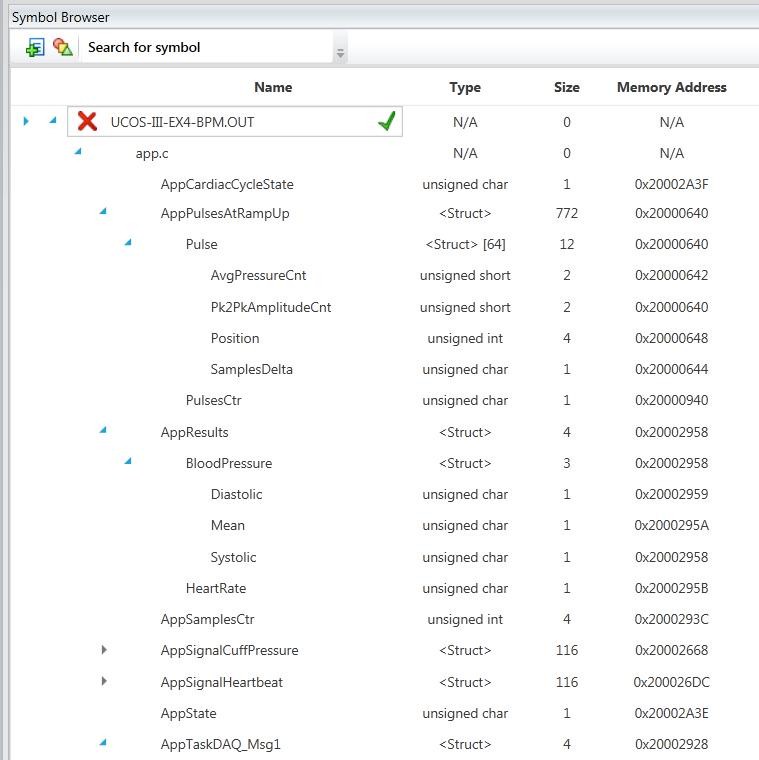
Creating a dashboard for your C code with µC/Probe is very easy; during design-time you create the dashboard in three easy steps; First, you have to provide μC/Probe with an ELF file with debugging information in the DWARF format versions 2, 3 or 4. The ELF file is generated by your toolchain’s linker. μC/Probe parses the ELF file and reads the addresses of each of the embedded target’s symbols (i.e. global variables) and creates an easy-tosearch catalog known as Symbol Browser, which will be later used to select the symbols you want to display on your dashboard.
Then, you create a μC/Probe workspace using a Windows PC and μC/Probe. You design your own dashboard by dragging and dropping virtual controls and indicators onto a data screen.

And finally, each virtual control and indicator needs to be mapped to an embedded target’s symbol by selecting it from the symbol browser, which provides a search box with search-asyou-type technology.
Run-Time
During run-time you can run C-SPY and µC/Probe concurrently, giving you two levels of visibility: the C implementation and system level respectively. As you step through your code with C-SPY you also get to see µC/Probe updating your dashboard. At the same time, you can also let C-SPY and µC/Probe run freely.
Other Features
µC/Probe offers many ways to visualize your data, including Bit Controls that allow you to read and write microcontroller’s peripheral registers:
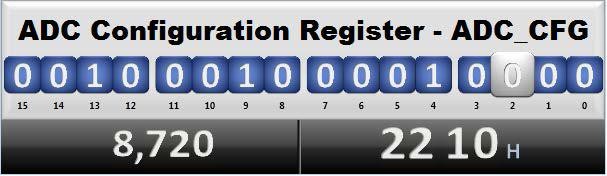
Figure 6. Bit Control
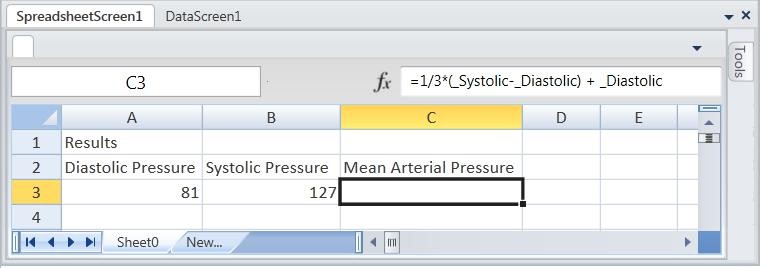
Higher level controls such as Spreadsheets, allow you to associate each cell with a symbol and use some of the features found in Microsoft Excel (formatting, formulas and functions):
And if your embedded design includes Micriµm’s µC/OS-III, then kernel awareness is built into µC/Probe in the form of a user-friendly multi-tab view for all the different kernel objects such as a task list that shows each task’s stack usage, CPU usage, and other important runtime statistics:
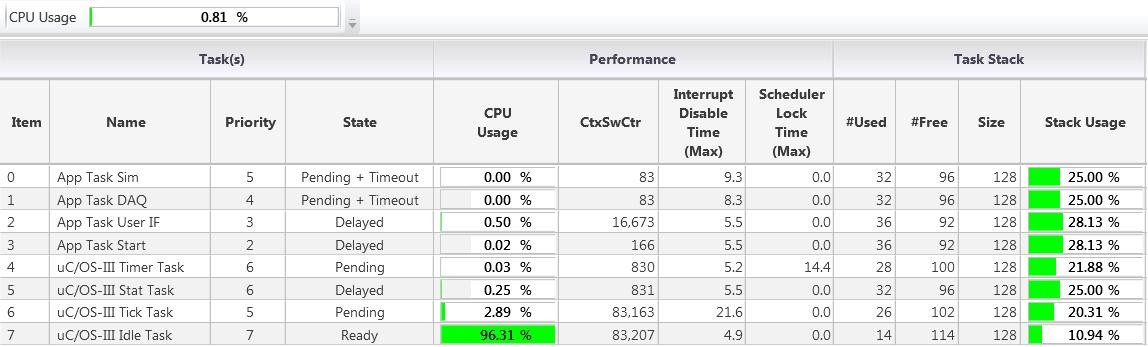
And if your embedded design includes Micriµm’s µC/OS-III, then kernel awareness is built into µC/Probe in the form of a user-friendly multi-tab view for all the different kernel objects such as a task list that shows each task’s stack usage, CPU usage, and other important runtime statistics:
Configuring the Bridge between IAR Embedded Workbench and µC/Probe
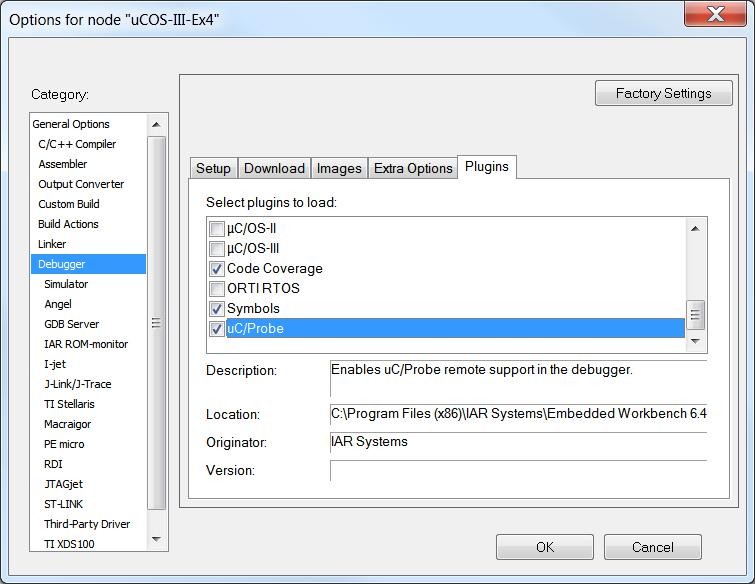
The TCP/IP bridge between C-SPY and µC/Probe is built in the form of a plugin module delivered with the IAR Embedded Workbench product installation. In order to configure IAR Embedded Workbench to load the plugin, you open your project’s debugger options and select the plugin from the list of available plugins as shown in Figure 9:
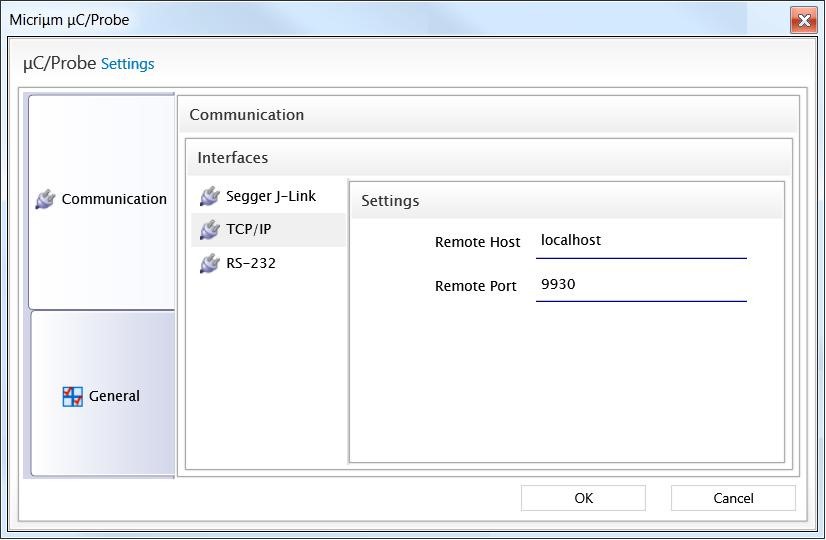
The plugin module gets loaded during a debug session and opens a TCP/IP socket on localhost to listen for µC/Probe requests. Depending on your network security settings, the first time you launch a debug session you may be asked to allow IAR Embedded Workbench to open a TCP/IP connection. At the same time, µC/Probe needs to be configured to connect through its TCP/IP interface to localhost on port 9930 as shown in Figure 10:
Conclusion
In embedded systems, it is important to understand the overall behavior of a system during the early development stage and guarantee that the application will behave as expected when it is embedded in the real world, even before the hardware exists.
µC/Probe empowers embedded software engineers to validate and optimize their designs at a stage where the cost of making any changes is minimal.
Visit the Micriµm website at http://www.micrium.com/probe to download an unlimited time, 5- symbol limit Trial Version of µC/Probe for free and discover a new way to build embedded systems.


